
A plant operation has fixed costs of $2,000,000 per year, and its output capacity is 100,000 electrical appliances per year. The variable cost is $40 per unit, and the product sells for $90 per unit. Solve, a. Construct the economic breakeven chart. b. Compare annual profit when the plant is operating at 90% of capacity with the plant operation at 100% capacity. Assume that the first 90% of capacity output is sold at $90 per unit and that the remaining 10% of production is sold at $70 per unit.
solution :)
Step 1 of 4:)
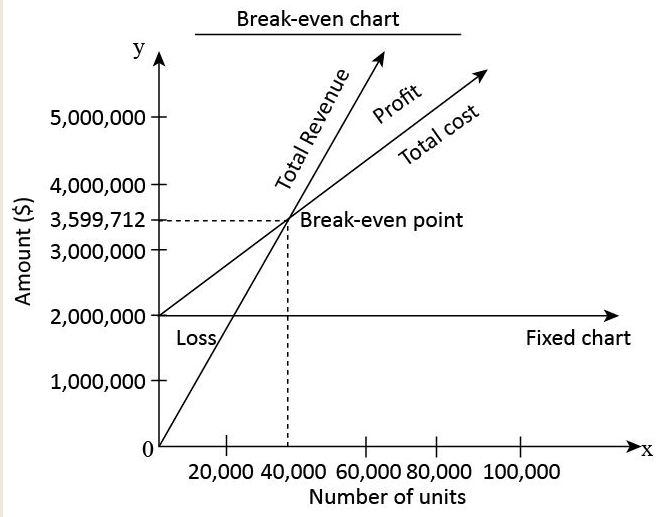
A Break-even chart is the graphic presentation depicting the break-even point. It consists of fixed cost, total revenue, total cost, number of units and amount. The point of intersection between total cost and total revenue is depicted as a break-even point.
Step 2 of 4:)
(A): Break-even chart:
Step 3 of 4:)
Sales per unit | $90 |
Less: Variable cost per unit | $40 |
Contribution per unit (A) | $50 |
Fixed cost (B) | $2,000,000 |
|
|
Break-even units (B/A) | 40,000 units |
Break-even in dollars:
Contribution margin (Contribution/Sales)*100 | 55.56% |
Fixed cost | $2,000,000 |
|
|
Break-even in dollars (Fixed cost/Contribution margin ratio) | $3,599,712 |
Step 4 of 4:)
(B): Profit/Loss:
90% Capacity:
Number of units at 90% Capacity (100,000@90%) | 90,000 |
Sales (90,000 @ $90) | $8,100,000 |
Less: Variable cost (90,000 @ $40) | $3,600,000 |
Less: Fixed cost | $2,000,000 |
|
|
Profit | $2,500,000 |
100% Capacity:
Sales (90,000*$90 + 10,000*$70) | $8,800,000 |
Less: Variable cost (100,000 @ $40) | $4,000,000 |
Less: Fixed cost | $2,000,000 |
|
|
Profit | $2,800,000 |
Post a Comment
Never enter the spam link in the comment section. If you have any inquiry, please let me know in the comment section.